Managing Servers
This section of the ODIN Fleet dashboard provides detailed information and controls for managing your deployed servers. You can view all your deployed servers, investigate their settings, monitor their performance, and review their logs. Below is a guide to help you navigate and utilize the server section effectively.
Server Instances
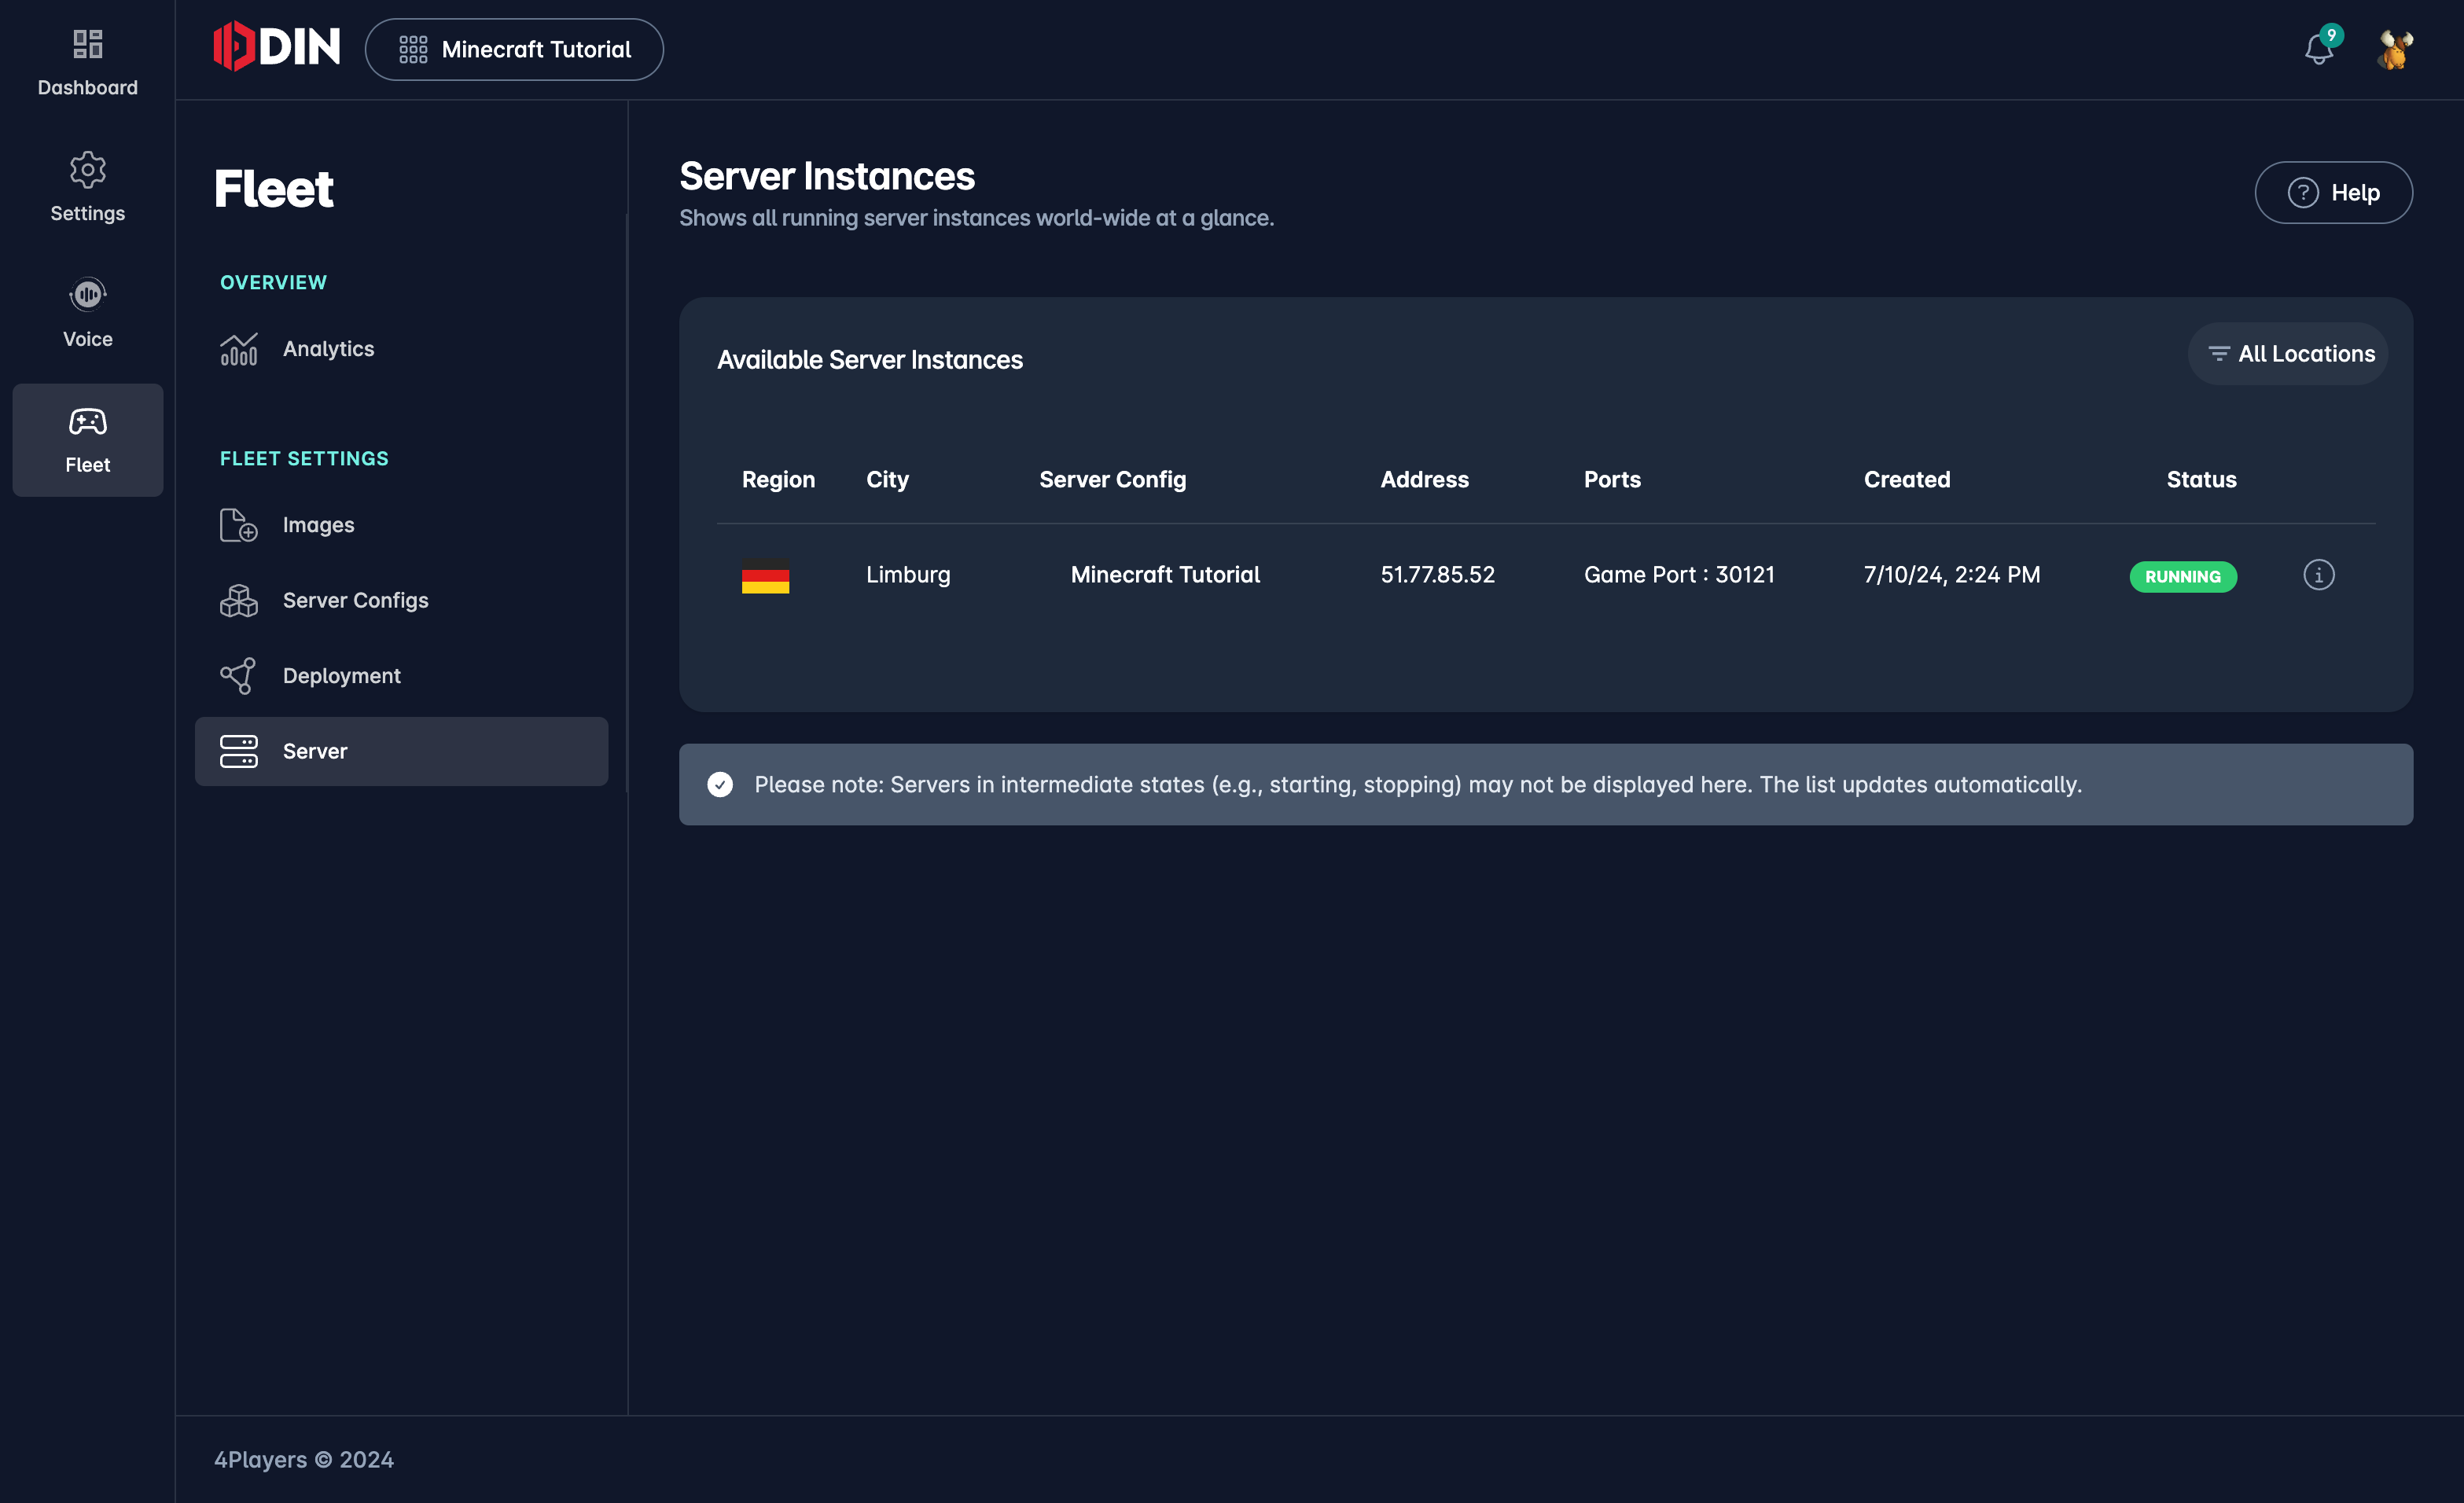
The Server Instances panel shows a list of all currently deployed servers. Each entry provides the following information:
- Region: The geographical location of the server.
- City: The specific city where the server is located.
- Server Config: The configuration used for this server instance.
- Address: The IP address of the server.
- Ports: The ports used by the server.
- Date: The date and time the server was deployed.
- Status: The current status of the server (e.g., Preparing, Running, Stopped).
You can filter the list of servers by location using the All Locations button.
Click on the small info icon at the right end of each server entry to view more details about that server.
Server Details
Clicking on a server instance will take you to the detailed view of that server. This view consists of several tabs: Info, Stats, and Logs.
Info Tab
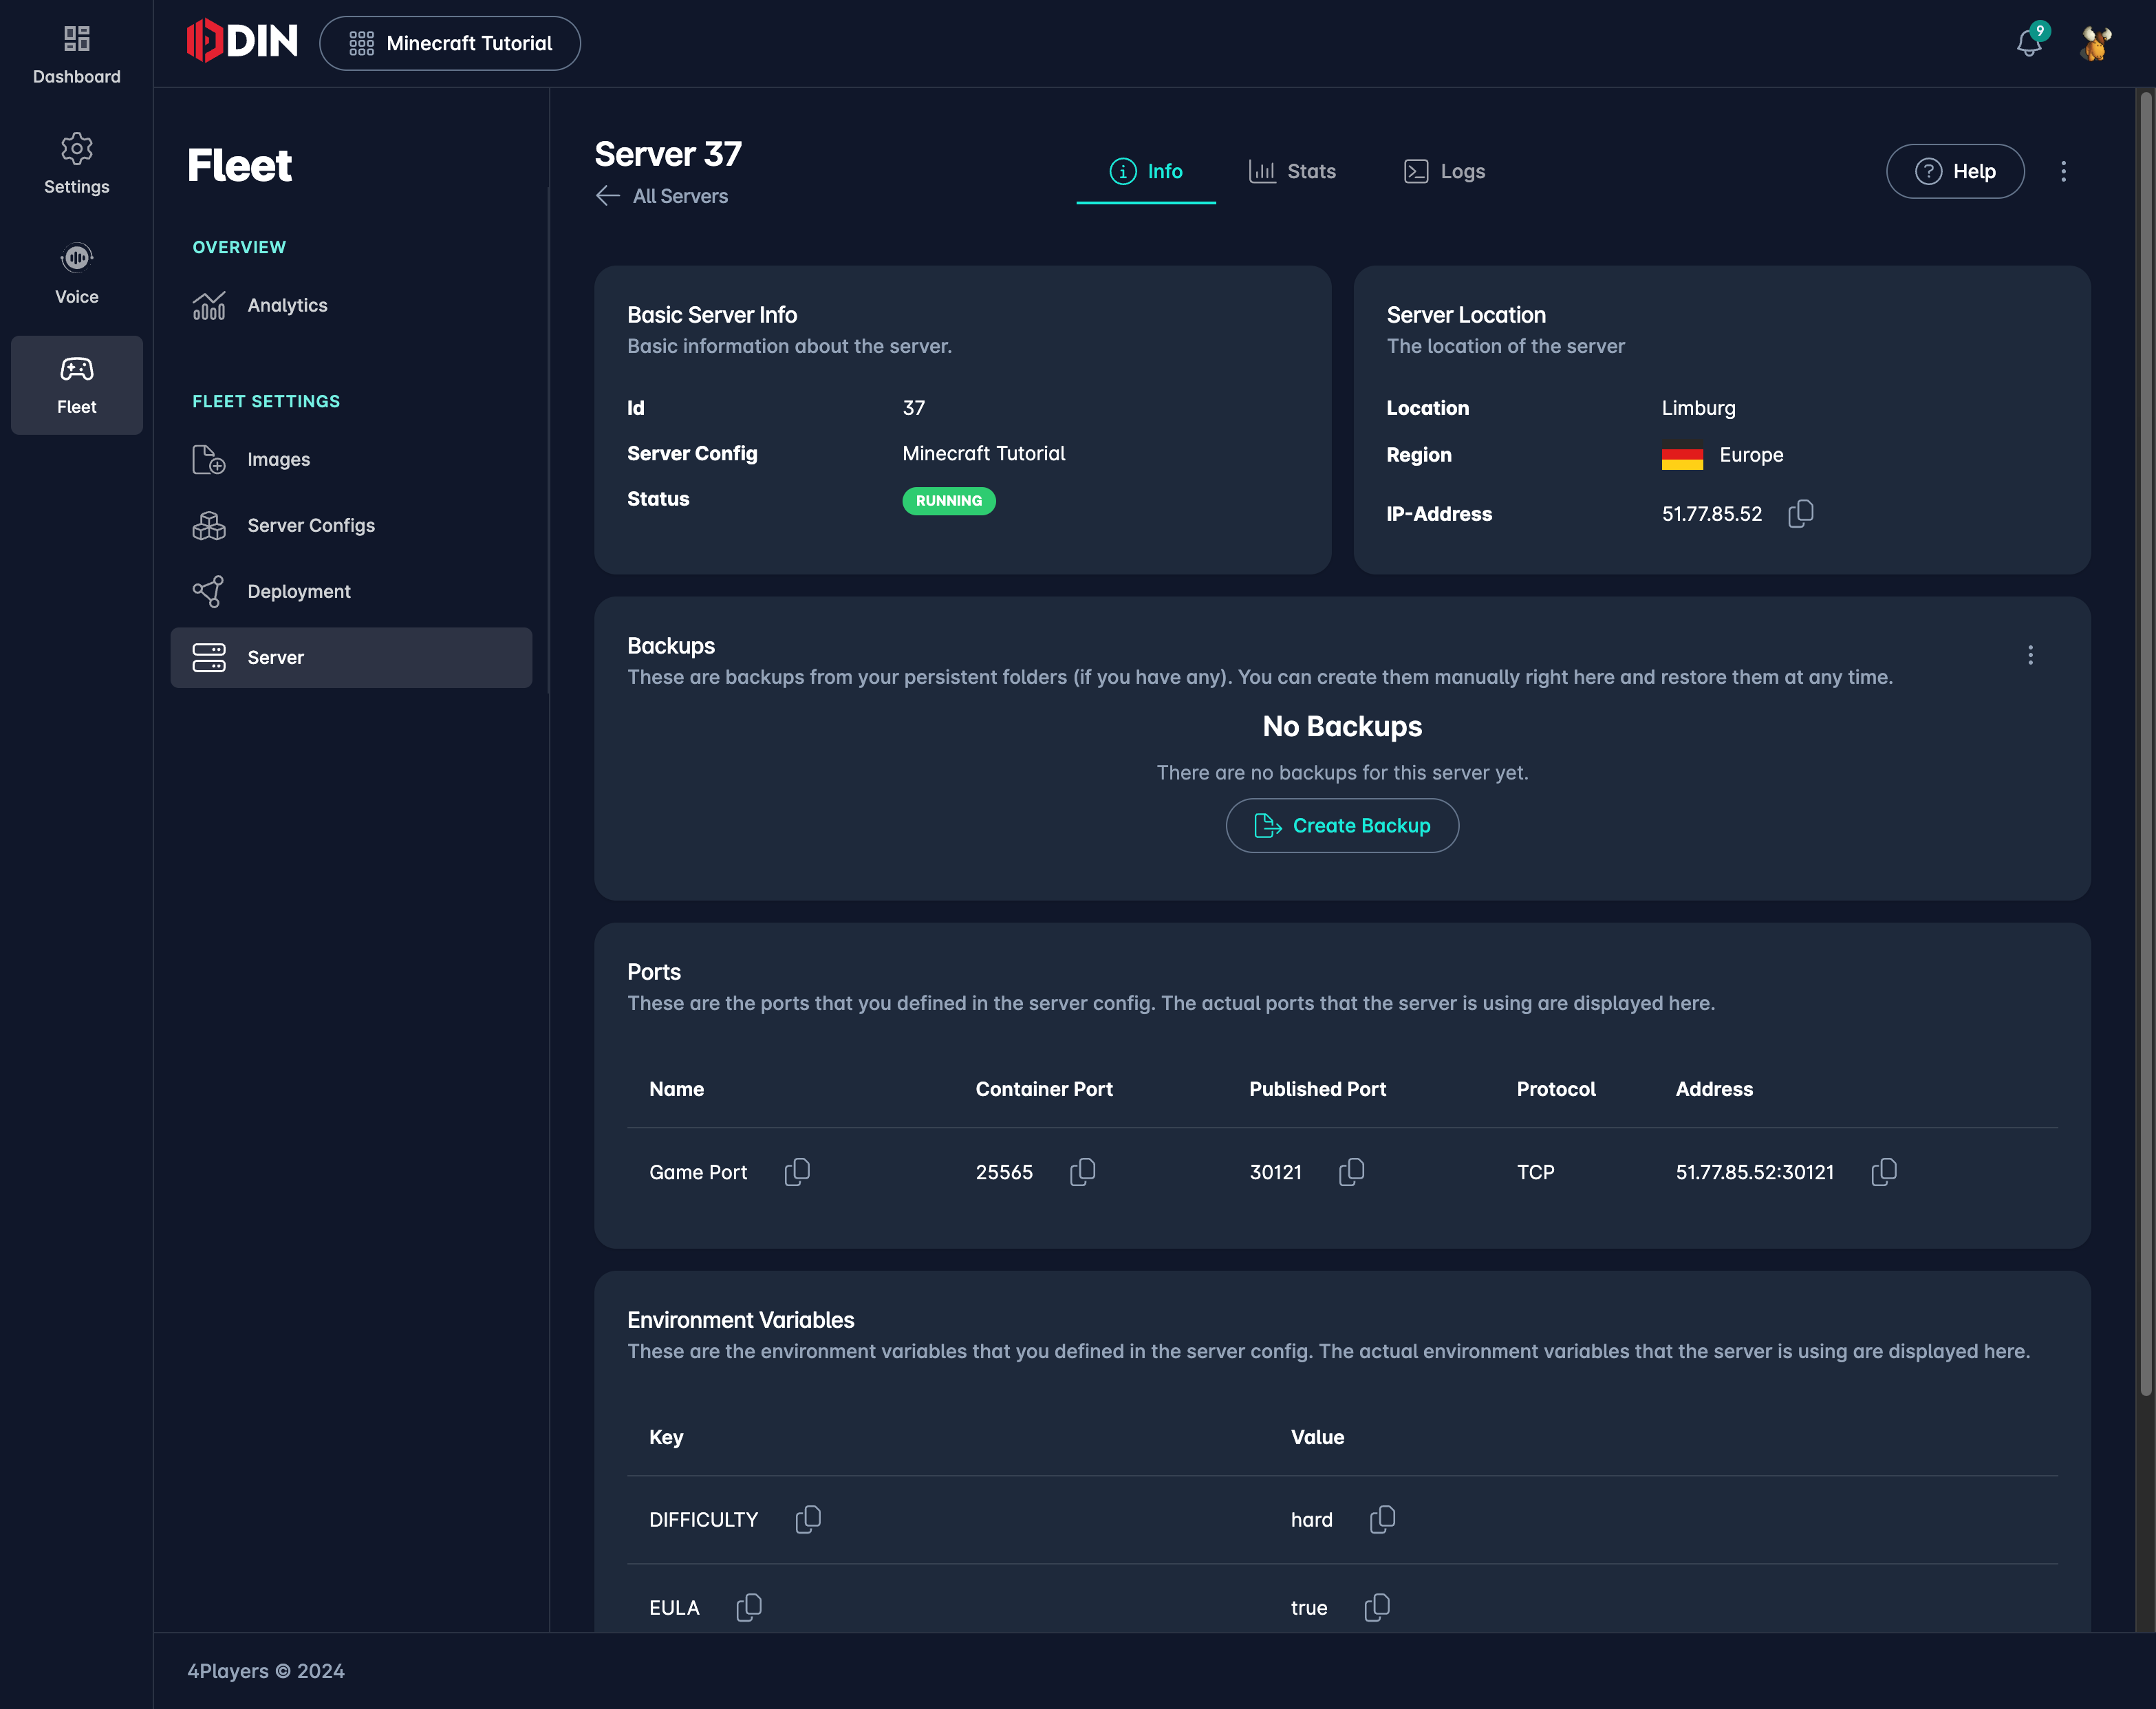
The Info tab provides basic information and configuration details of the server:
Basic Server Info:
- Id: Unique identifier of the server.
- Server Config: The configuration used for this server.
- Status: The current status of the server (e.g., Starting, Running, Stopped).
Server Location:
- Location: The geographical location and region of the server.
- IP-Address: The IP address of the server.
Backups:
- You can create and manage backups of your persistent data here.
Ports:
- Lists the ports defined in the server configuration, showing the container port and the corresponding published port on the host.
Environment Variables:
- Displays the environment variables set for this server, including static, system, and port variables.
Stats Tab
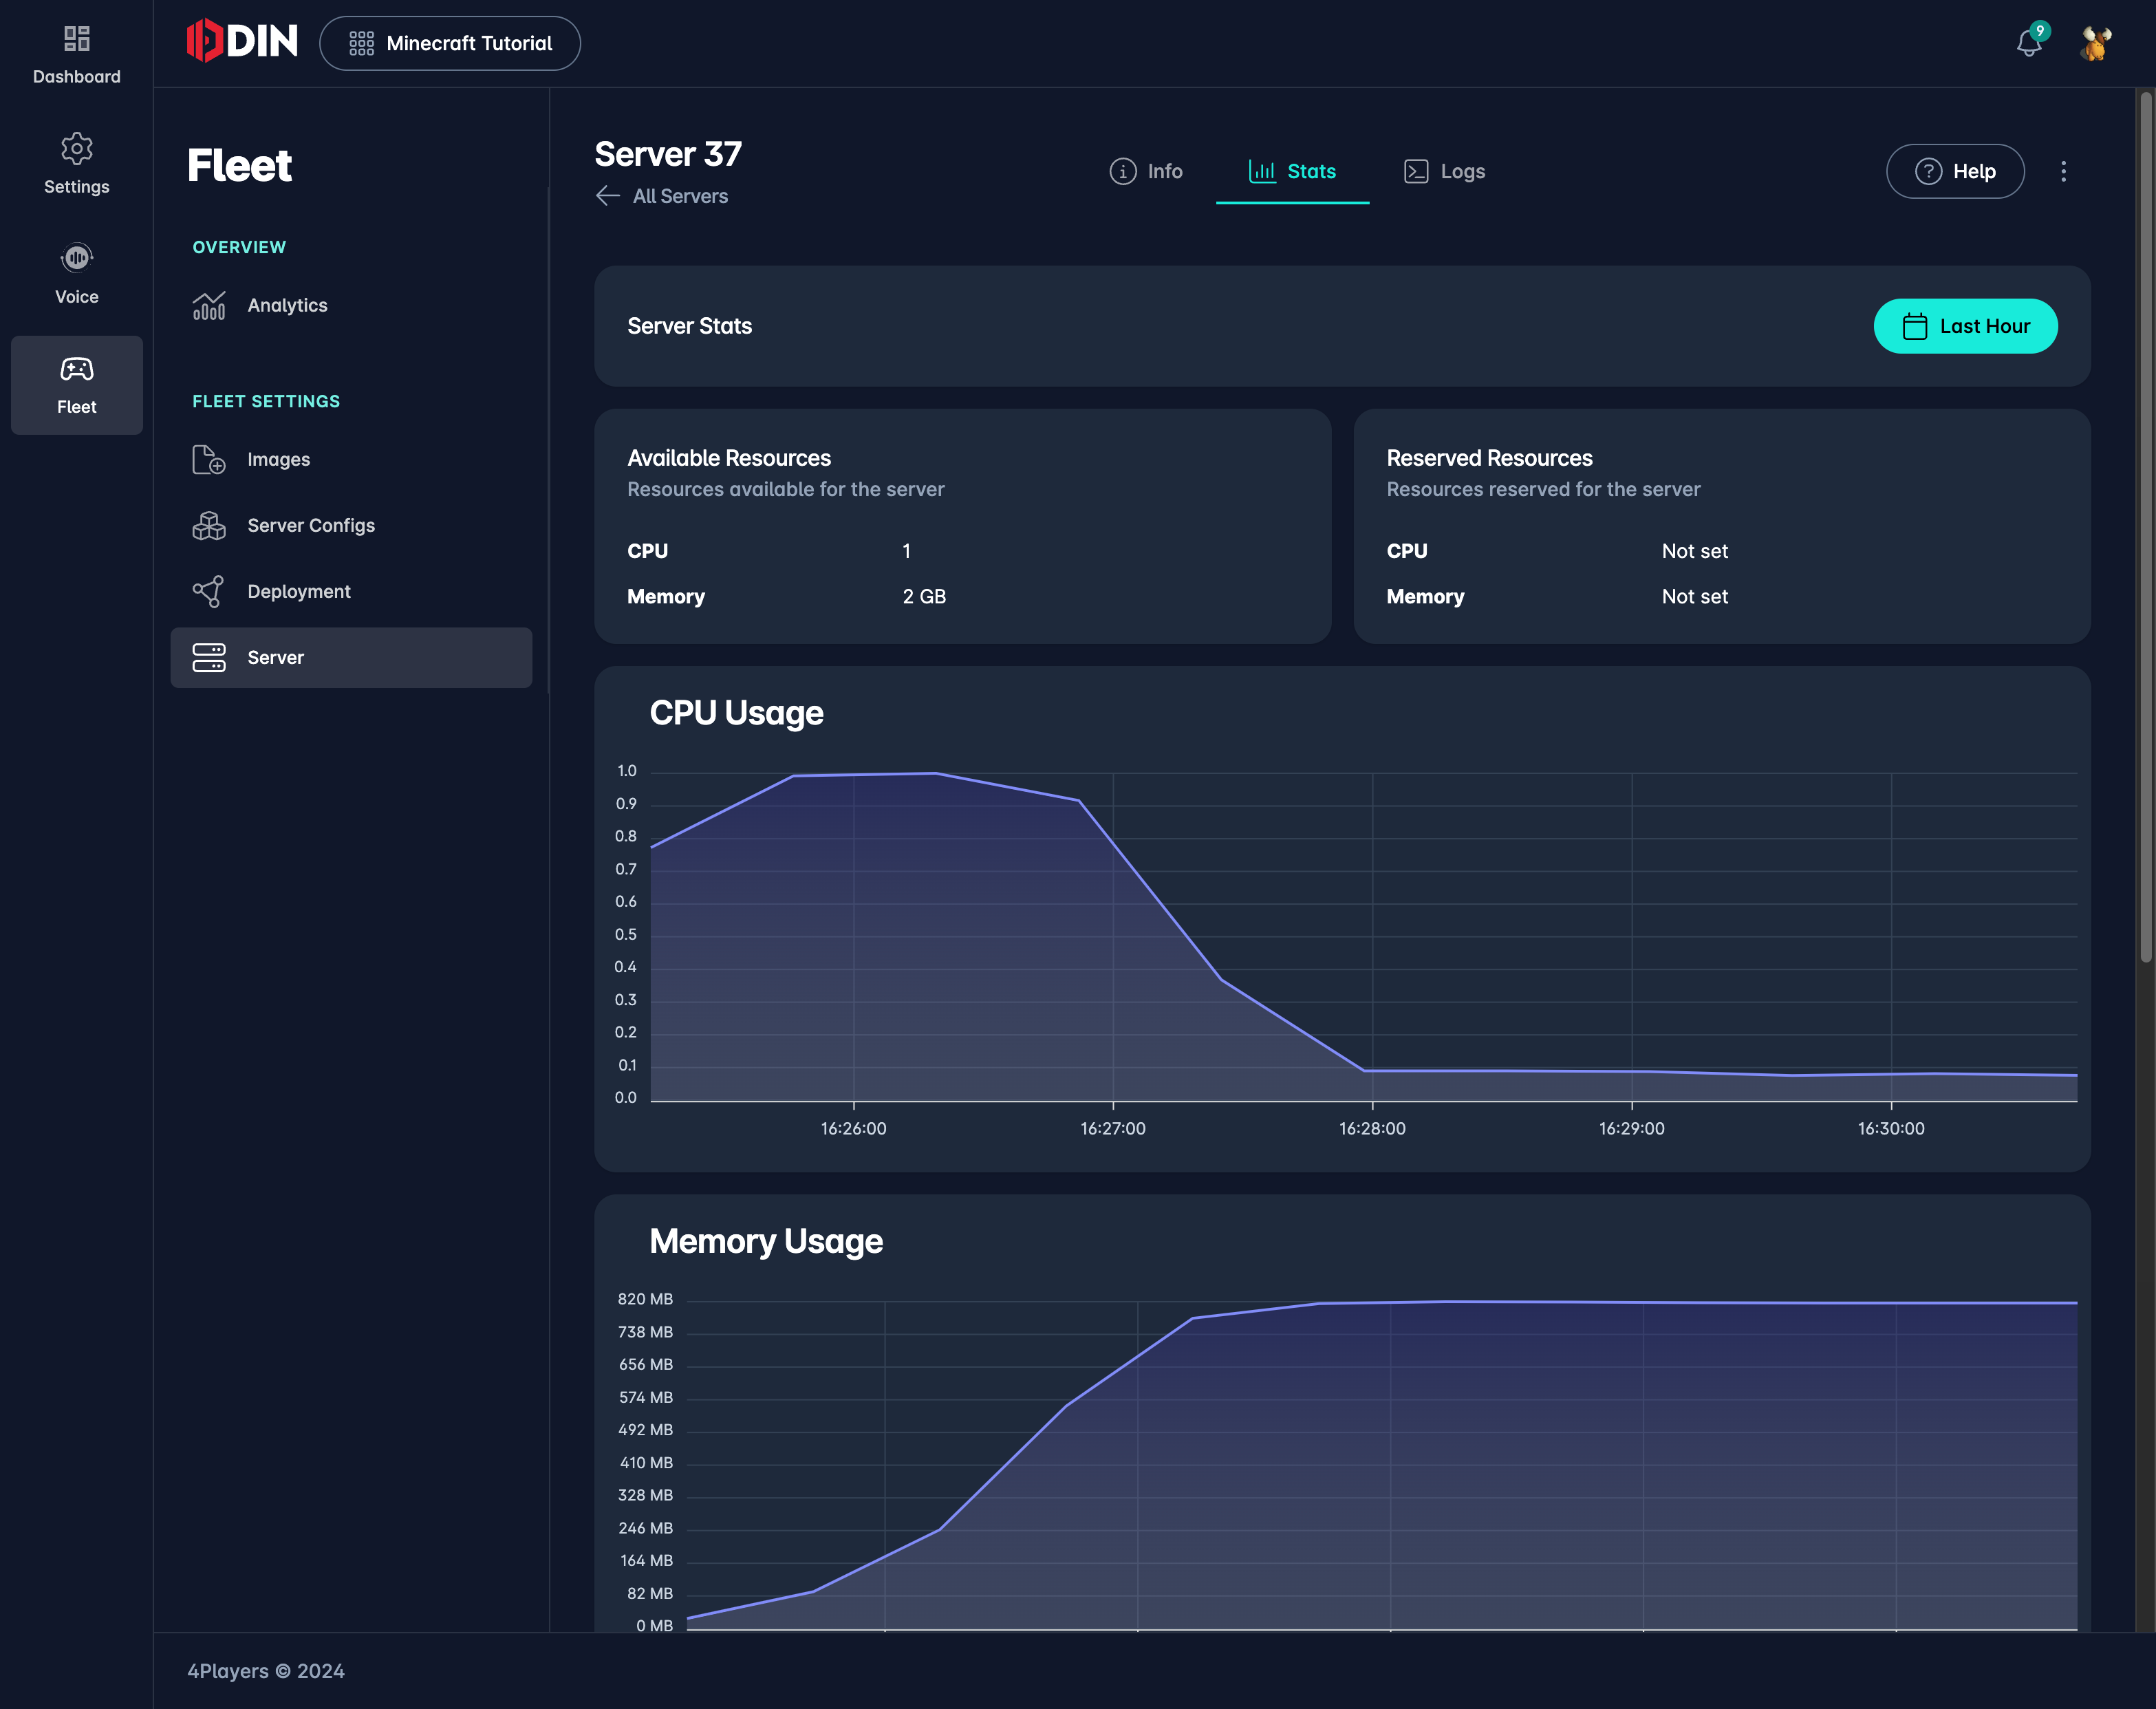
The Stats tab provides real-time performance metrics of the server, including:
- CPU Usage: Graph showing the percentage of CPU used over time.
- Memory Usage: Graph showing the amount of memory used over time.
- Network Ingress: Graph showing the incoming network traffic.
- Network Egress: Graph showing the outgoing network traffic.
- Disk Read: Graph showing the amount of data read from the disk.
- Disk Write: Graph showing the amount of data written to the disk.
Logs Tab
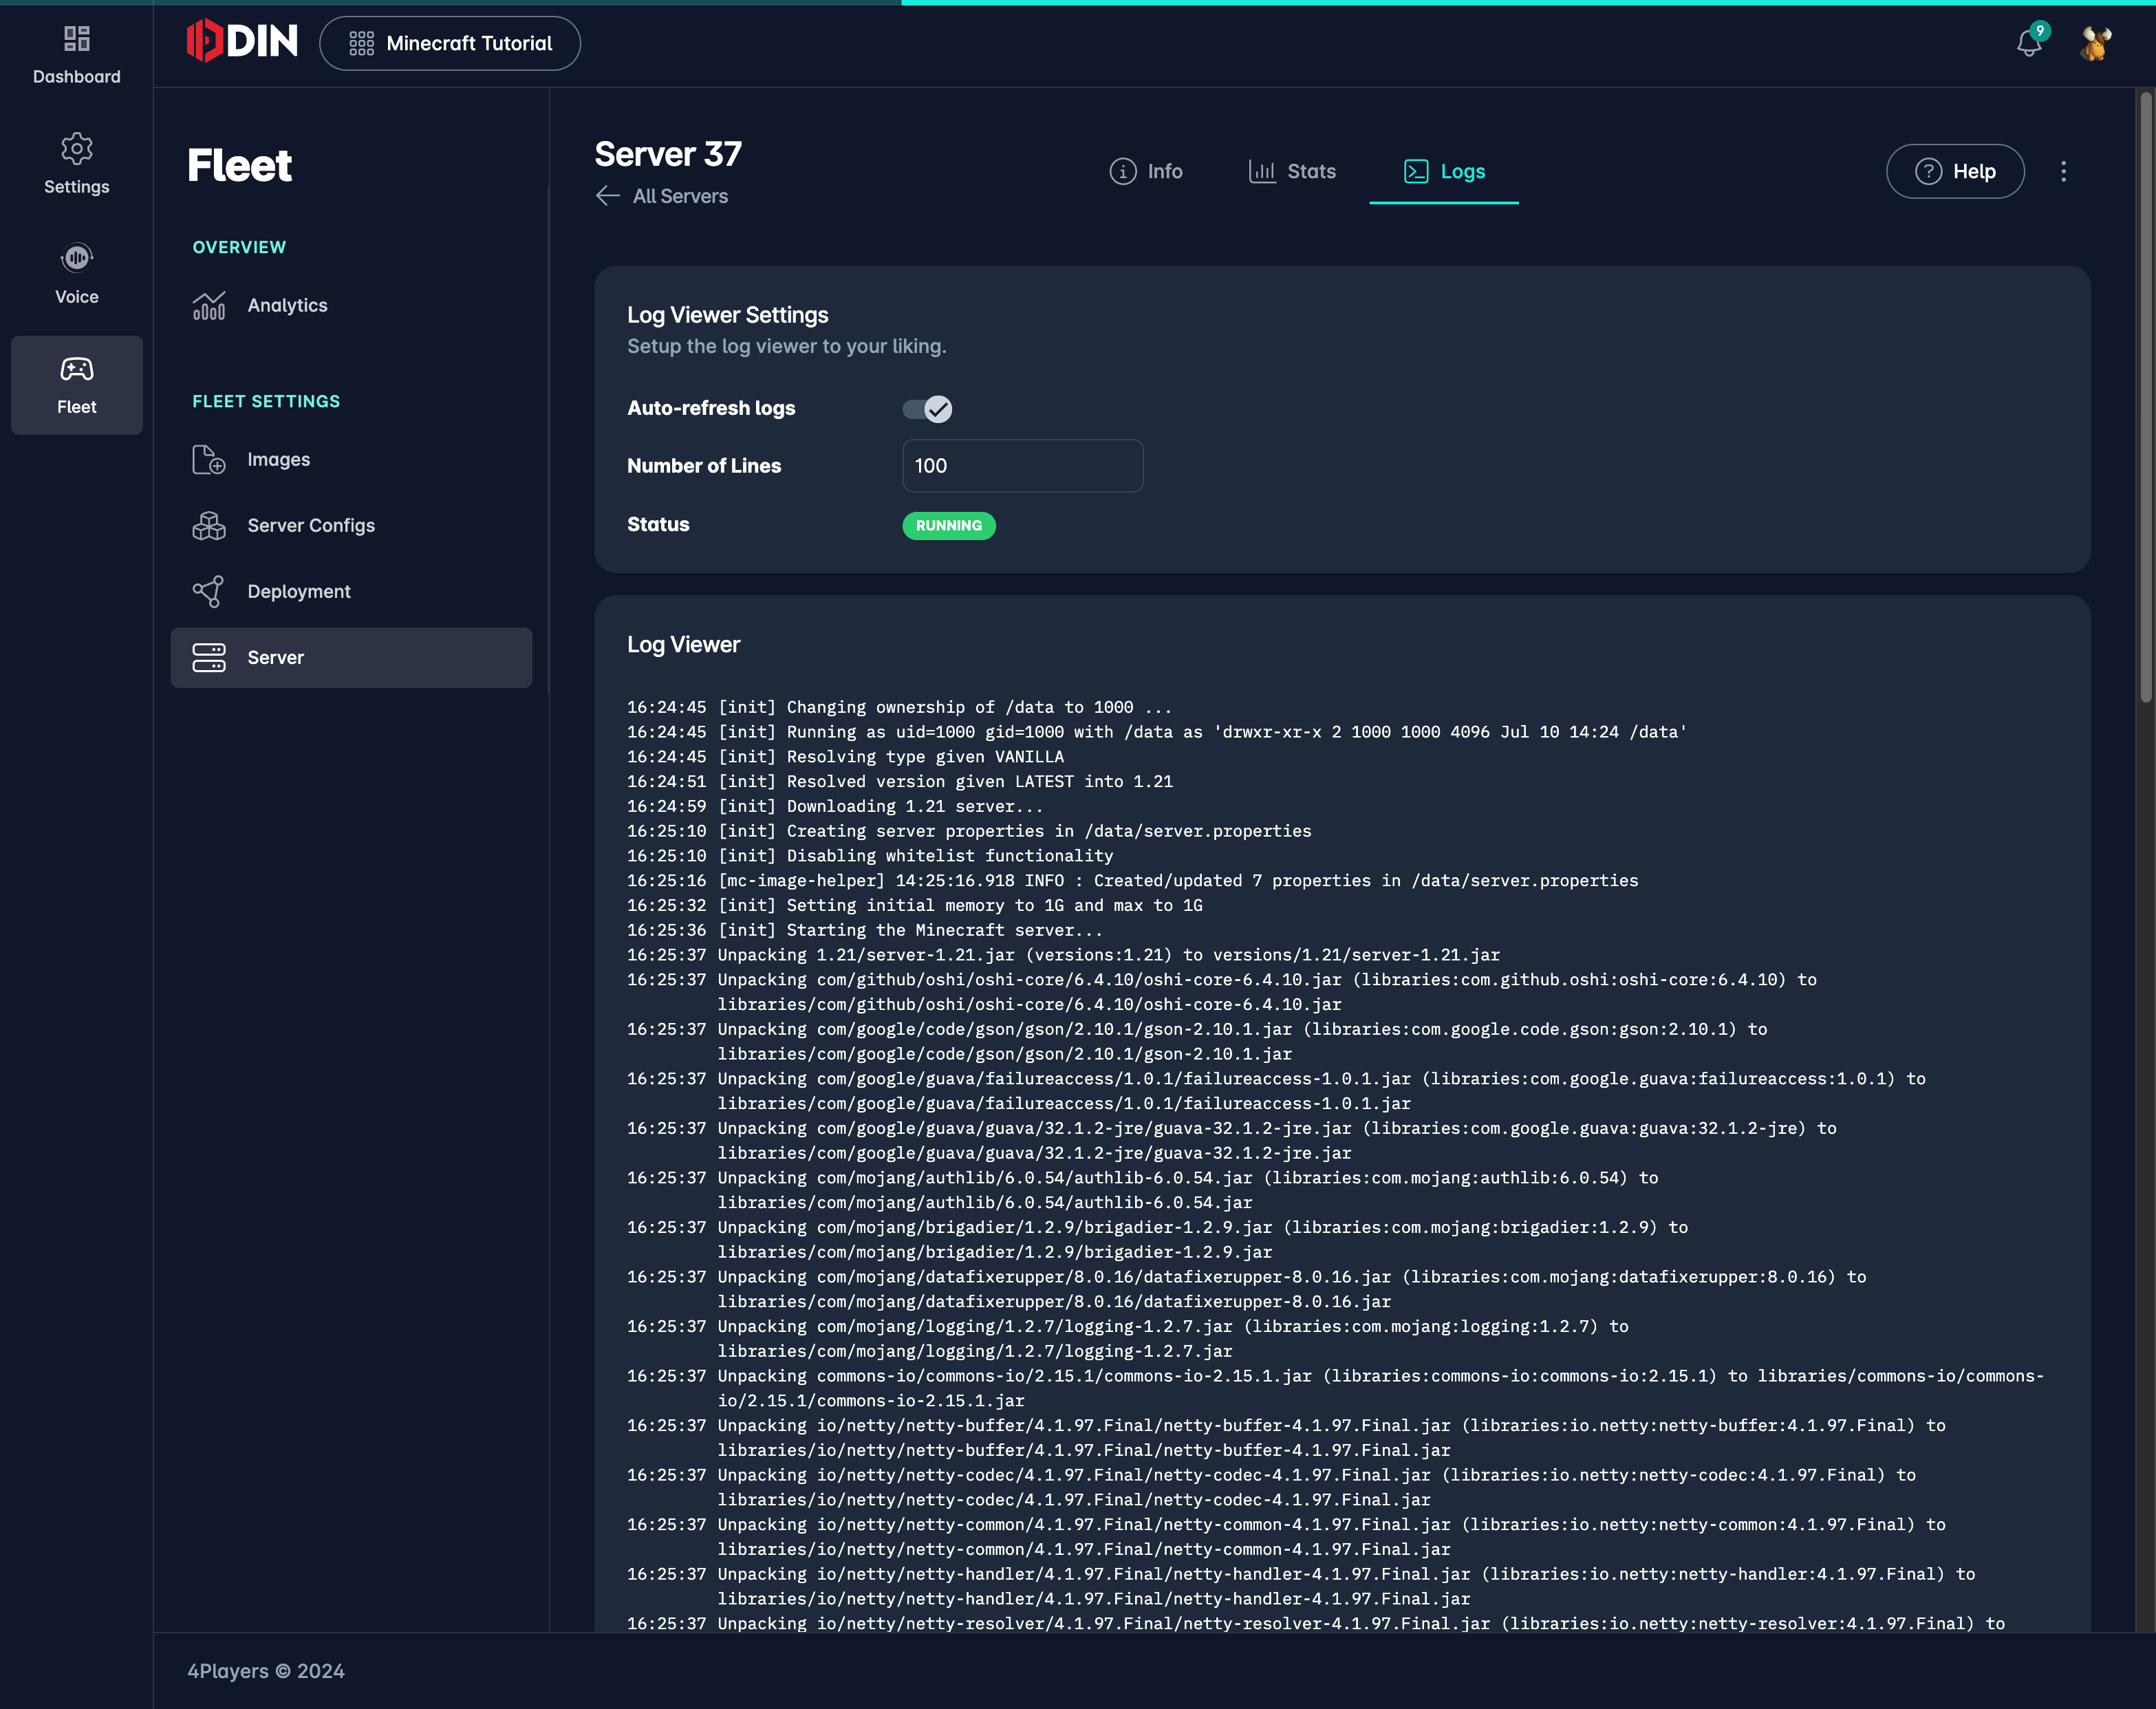
The Logs tab displays the log output of the server. You can adjust the settings to control the number of lines displayed and the auto-refresh interval. The logs provide detailed information about the server’s activities, useful for troubleshooting and monitoring.